visualization prototyping and scripting
Tutorials
- How to draw basic shapes with SUMMON (01_basics.py)
- How to use transforms: translate, rotate, scale, flip (02_basics.py)
- Hotspots and interactive visualizations (05_hotspots.py)
- more to come...
How to draw basic shapes with SUMMON (01_basics.py)
Open and run the example
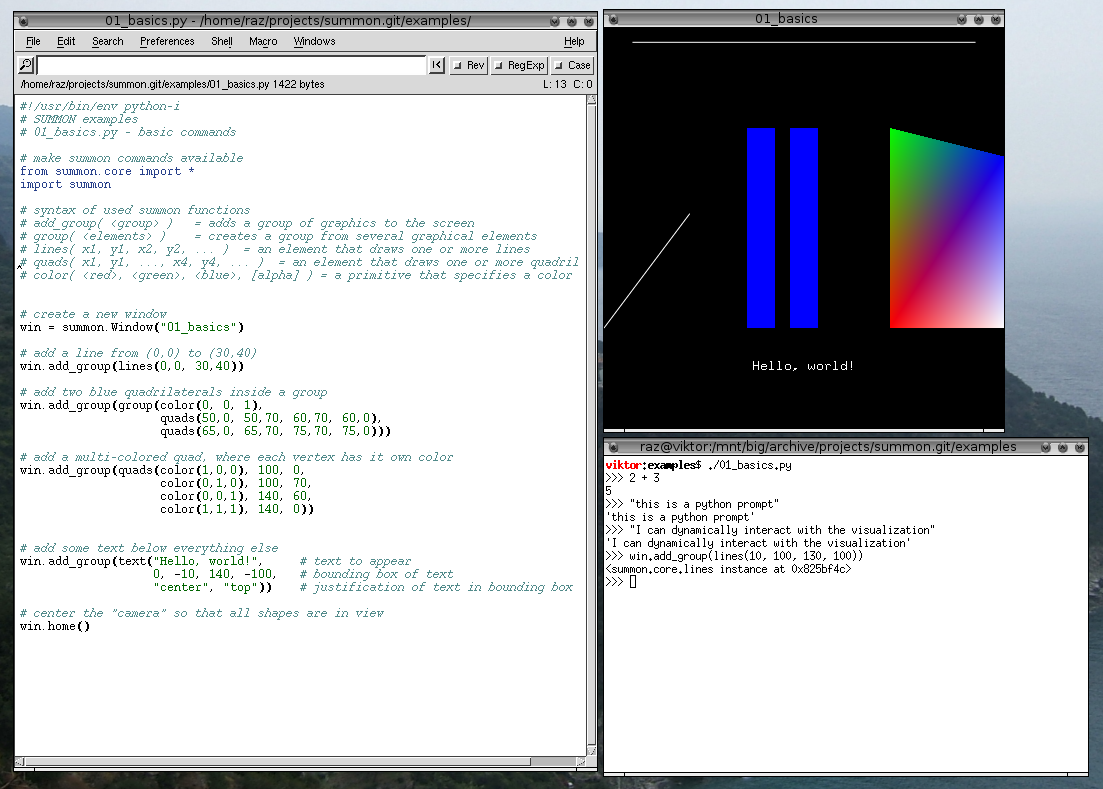
For an introduction to the basic API of the SUMMON module, let us walk through the code of the first example. This example is included in the source code (download) under the summon/examples directory. To begin, change into the summon/examples/ directory and open up 01_basics.py in a text editor. Also execute the example with following command.
The following visualization should immediately appear in a new OpenGL window.
Navigating the visualization
The following mouse and key-bindings are provided by default in SUMMON. You can use them to navigate your visualization. They can be customized with the set_binding function.
| Scroll & zoom | |
| left mouse button | activate/click |
| left mouse button drag | scroll |
| right mouse button | zoom (down: zoom-out, up: zoom-in) |
| More ways to scroll & zoom | |
| Ctrl + right mouse button | zoom x-axis (down: zoom-out, up: zoom-in) |
| Shift + right mouse button | zoom y-axis (down: zoom-out, up: zoom-in) |
| arrow keys | scroll |
| Shift + arrow keys | scroll faster |
| Ctrl + up key | zoom in |
| Ctrl + down key | zoom out |
| Shift + up key | zoom in (y-axis only) |
| Shift + down key | zoom out (y-axis only) |
| Shift + right key | zoom in (x-axis only) |
| Shift + left key | zoom out (x-axis only) |
| Miscellaneous | |
| middle click | display pop-up menu |
| h | home (zoom to make all graphics visible) |
| Ctrl + h | zoom 1:1 (restore zoom to 1:1 for x- and y-axis) |
| Ctrl + l | toggle anti-aliasing |
| Ctrl + d | duplicate window |
| Ctrl + p | output SVG of the current view |
| Ctrl + Shift + p | output PNG of the current view |
| Ctrl + x | show/hide crosshair |
| q | close window |
Overview of the example source code
In your text editor, the example 01_basics.py should contain python code similar to the code displayed below. The first two lines of the script import the summon module and all of the basic SUMMON functions (group, lines, color, etc) from the summon.core module into the current environment.
#!/usr/bin/env python-i # SUMMON examples # 01_basics.py - basic commands # make summon commands available from summon.core import * import summon # syntax of used summon functions # add_group() = adds a group of graphics to the screen # group( ) = creates a group from several graphical elements # lines( x1, y1, x2, y2, ... ) = an element that draws one or more lines # quads( x1, y1, ..., x4, y4, ... ) = an element that draws one or more quadrilaterals # color( , , , [alpha] ) = a primitive that specifies a color # create a new window win = summon.Window("01_basics") # add a line from (0,0) to (30,40) win.add_group(lines(0,0, 30,40)) # add two blue quadrilaterals inside a group win.add_group(group(color(0, 0, 1), quads(50,0, 50,70, 60,70, 60,0), quads(65,0, 65,70, 75,70, 75,0))) # add a multi-colored quad, where each vertex has it own color win.add_group(quads(color(1,0,0), 100, 0, color(0,1,0), 100, 70, color(0,0,1), 140, 60, color(1,1,1), 140, 0)) # add some text below everything else win.add_group(text("Hello, world!", # text to appear 0, -10, 140, -100, # bounding box of text "center", "top")) # justification of text in bounding box # center the "camera" so that all shapes are in view win.home()
Open your first SUMMON Window
A new SUMMON graphics window is created using the summon.Window class. The title of the of the new window will be "01_basics" and it will immediately open. The win object will allow us add and remove graphics to and from the window.
# create a new window
win = summon.Window("01_basics")
Creating your first drawing group: a line
All graphics are added and removed from the window in sets called groups. Groups provide a way to organize graphical elements into a hierarchy. The first graphical group added to the window is a line.
# add a line from (0,0) to (30,40)
win.add_group(lines(0,0, 30,40))
The line is created with the lines function, which takes a series of numbers specifying the end-point coordinates for the line. The first two numbers specify the x and y coordinates of one end-point (0,0) and the last two specify the other end-point (30,40). Next, the line is added to the window using the window's add_group function.
Nesting drawing elements with the group command
The next part of the example adds two quadrilaterals to the window with the quads and group commands.
# add two blue quadrilaterals inside a group
win.add_group(group(color(0, 0, 1),
                    quads(50,0, 50,70, 60,70, 60,0),
                    quads(65,0, 65,70, 75,70, 75,0)))
The arguments to the quads function are similar to the lines function, except four vertices (8 numbers) are specified. In the example, two quadrilaterals are created and grouped together with the group function, which takes an arbitrary number of drawing elements as arguments. Note, both the lines and quads functions can draw multiple lines and quadrilaterals (hence their plural names) by supplying more coordinates as arguments.
Adding color
The third group illustrates the use of color.
# add a multi-colored quad, where each vertex has it own color
win.add_group(quads(color(1,0,0), 100, 0,
                    color(0,1,0), 100, 70,
                    color(0,0,1), 140, 60,
                    color(1,1,1), 140, 0))
Color is stateful, as in OpenGL, and all vertices that appear after a color object in a group will be affected. The color function creates a color object, which can appear within graphical elements such as lines and quads or directly inside a group (see the previous code snippet for an example). Since each vertex in the quad above has a different color specified before it, OpenGL will draw a quadrilateral that blends these four colors.
Easy layout of text
Lastly, an example of text is shown.
# add some text below everything else
win.add_group(text("Hello, world!",     # text to appear
                   0, -10, 140, -100,   # bounding box of text
                   "center", "top"))    # justification of text in bounding box
Once again, the text is added to the window using the window's add_group function. The arguments to the text function specify the text to be displayed ("Hello, world!"), a bounding box specified by two opposite vertices (e.g. the lower left (0,-10) and upper right corners (140,-100)), and then zero or more justifications ("left", "right", "center", "top", "bottom", "middle") that will affect how the text aligns within its bounding box. There are currently three types of text: text (bitmap), text_scale (stroke), and text_clip (stroked text that clips). The bitmap text will clip if it cannot fit within its bounding box. This is very useful in cases where the user zooms out very far and no more space is available for the text to fit. See the example 10_text.py for a better illustration of the different text constructs.
Bring it all into view
The final function in the script is win.home(), which causes the SUMMON window to scroll and zoom such that all graphics are visible. This is a very useful command for making sure that what you have drawn is visible in the window. The command can also be executed by pressing the 'h' key within a SUMMON window. This key comes in handy when you "lose sight" of the visualization.
And much more...
This is only a simple example. There are many more drawing functions:
- text_scale
- points
- lines
- line_strip
- triangles
- triangle_strip
- triangle_fan
- quads
- quad_strip
- polygon
- color
- text
- text_scale
- text_clip
See the remaining scripts in the summon/examples/ for examples of SUMMON's more powerful features. For more documentation, also see the manual and online API documentation.